Theoretical vs actual food cost: what it is and how to close the gap
By Asaad Al Hashmi, Founder and CEO of Wady

Theoretical food cost is what your food should have cost, based on your recipes and what you sold. Actual food cost is what it did cost, based on your stock counts and purchases. The difference is your food cost variance, and every riyal of it left the kitchen without being sold or explained. This page covers both definitions, the formula, a worked burger example in QAR, the usual causes, and a weekly routine.

Theoretical cost is what each plate should use. Actual cost is what left the shelf.
Key takeaways
Theoretical food cost is recipe cost times items sold; actual food cost is opening stock plus purchases minus closing stock.
The gap between them is food cost variance. In the example below, a burger that should run at 25% ran at 27.1%, a QAR 3,000 gap in one month (example numbers).
Most of the gap comes from a short list: unrecorded waste, over-portioning, deliveries not received in the system, price changes and typing errors.
Close it with a weekly count, a short list of the biggest differences, and one cause checked per difference.
What is theoretical vs actual food cost?
Theoretical food cost (also called ideal or recipe food cost) is the cost of the food your sales say you used. Take each item sold, multiply by its recipe cost, and add it up. It assumes every portion is made exactly to the recipe, nothing is wasted and every price is current.
Actual food cost is the cost of the food that left your stock. You get it from counts and purchases: opening stock, plus what you received, minus closing stock.
Variance is actual minus theoretical. If actual is higher, food is going somewhere your sales do not explain. A small variance is normal, because no kitchen is perfect. A growing one is a signal.
What is the formula for food cost variance?
Theoretical cost = items sold x recipe cost per portion
Actual cost = opening stock + purchases - closing stock
Variance (QAR) = actual cost - theoretical cost
Variance (points) = actual food cost % - theoretical food cost %
Both percentages use the same food sales as the base. How to get recipe cost per portion, including usable yield, is covered in how to calculate food cost. This page starts where that one stops: you have both numbers, and they disagree.
Worked example: one burger in Doha
Example numbers. Round, hypothetical figures. They are not Wady data.
A burger sells for QAR 36 and its recipe cost is QAR 9.00. Theoretical food cost is 9 / 36 x 100 = 25%.
In one month the restaurant sells 4,000 burgers.
Food sales: 4,000 x QAR 36 = QAR 144,000
Theoretical cost: 4,000 x QAR 9.00 = QAR 36,000, so 25.0%
Opening stock QAR 8,000 + purchases QAR 36,500 - closing stock QAR 5,500 = QAR 39,000 of food used
Actual food cost: 39,000 / 144,000 x 100 = 27.1%
The variance is QAR 3,000, or 2.1 points. The recipe says QAR 36,000 of food was needed. The stock says QAR 39,000 went.
Now look for it. In this example, the QAR 3,000 breaks down like this:
QAR 1,600: cooks add about 10 g of extra beef per burger, which at QAR 40 per kilo is QAR 0.40 on each of 4,000 burgers
QAR 700: spoiled and dropped food that nobody recorded
QAR 400: a supplier price rise that the recipe cost never picked up
QAR 300: a delivery entered wrongly in the system
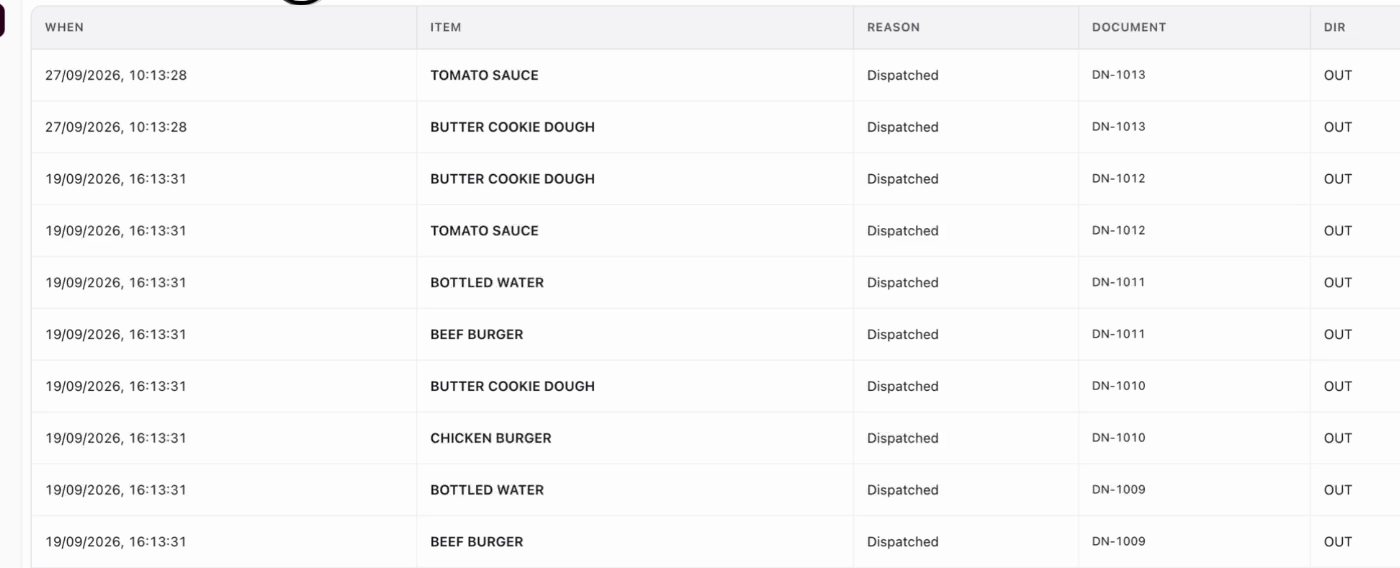
Every stock movement on one ledger, with its reason and document. An example screen.
You cannot find a breakdown like this from a monthly total alone. You need movements recorded with a reason, which is why the routine below is weekly.
What causes the gap between theoretical and actual food cost?
Five causes explain most variance.
Waste that was never recorded
Food spoils, gets dropped, is returned to the pass or is over-prepped and thrown out. If no one records it, it shows up as variance.
Over-portioning
The recipe says 150 g and the cook uses 160 g. Each time it costs little. Across thousands of plates it is often the largest single line, as in the example. Operators in Qatar say the recipe lists 100 grams and the cook used 200.
Deliveries not received in the system
A delivery arrives and is not entered, entered twice, or entered short. Stock sent from a central kitchen to an outlet is never confirmed. On paper it is gone. In fact, nobody knows whether it arrived. Either way, the book and the shelf disagree.
Price changes
Your recipe cost was typed when chicken cost QAR 20 per kilo. It now costs QAR 22. Theoretical cost uses the old price while actual cost uses the new one, so the variance grows with nothing changing in the kitchen. See recipe costing software for how re-costing works.
Typing errors
One wrong digit runs for a month. 336 typed as 0.336 means a count of 336 kilos is read as under half a kilo. Nothing questions it at the time, and every report after it is quietly wrong.
Where should you look for each cause?
Cause | What it looks like | Where to look |
|---|---|---|
Unrecorded waste | Variance on perishables, worst after busy or slow days | Waste entries by reason and item, and what was thrown out |
Over-portioning | Variance concentrated on high-volume, high-cost items such as beef and cheese | Spot-weigh portions at the pass against the recipe card |
Deliveries not received | Item balances below zero, or stock "in transit" for days | Purchase orders against received quantities, and outlet confirmations |
Price changes | Variance on items whose supplier price moved | Latest invoice price against the price in the recipe |
Typing errors | One item far out, with a round or odd count | The count sheet and delivery entries for that item |
How do restaurants close the gap, week by week?
Monthly is too late. By the time the month ends, the cause is five weeks old and nobody remembers it. Run this once a week.
Count. Count the items that matter most, the expensive and fast-moving ones, using the steps in restaurant stock count. Blank means not counted, zero means none.
Compute. Work out actual usage for each counted item: last count plus received minus this count. Compare it with theoretical usage from sales.
Rank. Sort the differences by riyal value, not by percentage. Look at the top three.
Check typos first. A count of 0.336 where you expected 336 is cheaper to fix than a theft investigation.
Assign one cause per difference. Use the table above. Write it down.
Fix at the source. Re-weigh portions, record the waste, correct the delivery, update the price.
Review next week. If the same item shows up again, the fix did not work.

The Wady Central daily brief flags odd numbers and stock below zero. An example screen, not a real customer's numbers.
For a wider comparison of tools, see the best restaurant inventory management software in Qatar.
How Wady helps with theoretical vs actual food cost
Wady Central is Wady's paid product for multi-branch groups and central kitchens, built in Qatar. It does not guess your variance. It keeps the records that make the gap explainable.
What it does
One ledger. Every movement lands on one list, and each line carries its reason and the document behind it. Nothing moves stock without a line.
Real yield costing. Recipes are costed on usable weight after trim, so cleaning loss sits in the price.
Re-costed when a price moves. A recipe is re-costed the moment a price moves, and price rises and falls are flagged on delivery.
What changed, and why. The Daily Brief names the recipes whose cost moved and the ingredient behind each move, in riyals.
Counts and waste. Count in sacks and grams, review the differences with likely typos first, and enter a shift's waste in one go with your own reasons. See counts and waste.
Odd numbers questioned. Numbers that look wrong are questioned as they are typed, and negative balances are flagged, never hidden.
What it does not do
Wady Central works alongside your POS and does not connect to any POS by API yet. Theoretical usage needs your sales numbers, so today you bring those in from your POS yourself. Wady Central is in English only today. An Arabic version and a mobile app are planned.
Who it is for
Wady Central is for restaurant groups, central kitchens and catering companies. Current prices are on the pricing page, with no VAT. Over 100 businesses in Qatar already use Wady Central, including Crave Holdings and OMC. A walkthrough on your own setup takes 20 minutes.
FAQ about theoretical vs actual food cost
What is a good food cost variance?
There is no single number that fits every kitchen. The useful test is direction and cause: is the gap stable, and can you explain it?
Is actual food cost always higher than theoretical?
Usually, because real kitchens waste and over-portion a little. Actual can come out lower if closing stock is overcounted, a delivery is entered but never arrived, or recipes are costed too high. A gap in either direction means a record is wrong.
How often should I check actual vs theoretical?
Weekly for high-cost items, and monthly for the full picture. Waiting for month-end hides the cause.
Can I work out theoretical food cost without sales data?
No. Theoretical cost needs the number of each item sold, which comes from your POS or sales records. Wady Central works alongside your POS and does not connect to one by API yet.
Can I do this in a spreadsheet?
Yes, for a few items and one person who owns the file. It gets hard when prices move, several outlets share stock and a wrong digit stays in the sheet until someone finds it.
Related articles
Best restaurant inventory management software in Qatar
See your gap on your own setup
Book a 20-minute walkthrough of Wady Central and see where your food cost goes. Start with counts and waste.
Your kitchen's stock, recipes and costing, with numbers from real records.


